Sample Preparation
Homogenization
Heating and Mixing
Electrophoresis and Blotting
Polyacrylamide Gel Electrophoresis
Agarose Gel Electrophoresis
Western Blotting
Power Supplies
PCR & qPCR Thermal Cycler
Thermal Cycler (PCR)
Real-time Thermal Cycler (qPCR)
PCR Workstations & Cabinets
UVP BioImaging Systems
Molecular Spectroscopy
Lab Equipment
Ultraviolet Products
Hybridization Ovens
UVP Incubator
UV Crosslinkers
UVP Benchtop Transilluminators
Thermal Mixers
Electrophoresis & Blotting
Thermostats
View All
Fume hood
Laminar Airflow
Biosafety Cabinet
Autoclave
Centrifuge
pH Meter
Shaker & Mixer
Orbital Shaking Incubator
BOD Incubator
Heating Oven
Water Purification System
Aermax - Air Purification
Medical Oxygen Concetrators
Hygiene Solution
-150°C Cryogenic Freezer
-86°C Ultra Low Temp Freezer
-40°C Low Temp Freezer
-18 ~ -25°C Biomedical Freezer
-20°C Biomedical Freezer
4° ± 1°C Blood Bank Refrigerators
2~8°C Pharma Refrigerators
2~8°C ICE Lined Refrigerators
-25°C ~ + 4°C Mobile Freezer/Collers
20~24°C Blood Platelet Incubators
Ice Machines
Coldrooms
Mortuary Chambers
Besides chemical analysis, there are many physical methods performed to characterize purity and determine the mixture of substances. Even though there are many techniques such as determination of melting point, refractive index, and density, UltraViolet and Visible light spectroscopy is widely applied in a market segment, research areas, production, and quality control for the classification and study of substances.
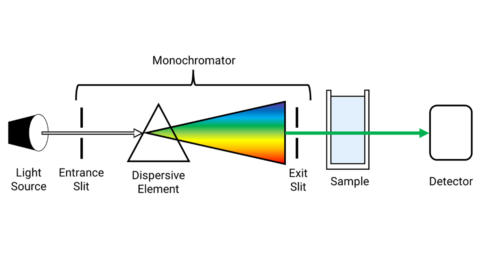
UV/VIS spectrophotometer measures the absorption of light by the sample when the UV light source is passed through the sample. Each substance has the unique property of absorbing light.
The amount of light absorbed is related to the concentration of the substance in the sample and thus, the quantitative analysis is possible by UV/Vis spectrometer. Modern UV/VIS spectrophotometer facilitates fast, easy, reliable, and accurate results. This article provides different applications of UV/Vis spectrophotometer.
Read more : How Does a Modern UV-Vis Spectrophotometer Work?
Five major reasons to use UV Visible spectrophotometer in analytical chemistry are,
Read more : UV Spectrophotometry Identifies Compounds in Pharmaceuticals
The application of UV/Vis spectrophotometer is mainly concentrated on qualitative and quantitative analysis.
UV/Vis spectroscopy is an analytical tool that allows you to determine the purity of the analyte and it does not undergo decomposition. The qualitative analysis technique is used to perform quality control checks for raw material and biologically relevant compounds such as nucleic acids, DNA, and RNA.
With the measurement of the UV/Vis spectrum at different temperatures, the melting point of the DNA can be determined. UV/Vis spectroscopy is used to check the purity of olive oil. It is possible to differentiate the saturated and unsaturated fatty acids present in olive oil.
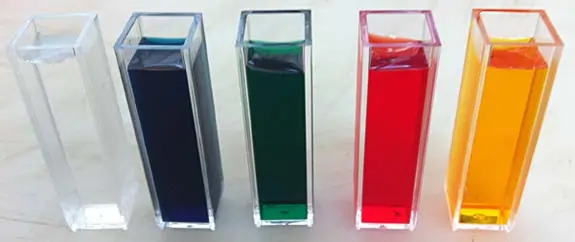
Samples absorb light at a specific wavelength with unique absorbance values. Each sample has a unique spectrum and it is compared to the known spectra of the sample, i.e., pure compounds.
For example, here the absorbance spectrum of different compounds is shown. The molecular structure of the compounds differs from each other. This unique relationship of the UV/Vis spectrum allows the characterization of the sample. Here in the above figure, compounds such as Malvidin, Chlorophyll A, and Chlorophyll B can be easily distinguished with the individual absorbance spectra.
Based on the Lambert-Beer law, the compound concentration in a solution can be easily determined quantitatively with UV/Vis Spectroscopy. A calibration line is determined by measuring the absorption of standard solutions of known sample concentration. In this method, the concentration of DNA, RNA (i.e., nucleic acid quantification), proteins, carbohydrates, or organic compounds can be easily determined.
The linear relationship between the concentration of the solution and the absorbance value of the samples. The three main applications of Lambert-Beer law is
Fixed wavelength measurement is the simple application of a spectrophotometer. Both single wavelength or multiple wavelength measurements can be made and the results are reported in terms of absorbance and transmittance.
In food and beverage applications, UV/Vis spectroscopy is used to monitor and enhance quality control of the products. Furthermore, the influence of stabilizers, chemical deterioration, packaging material, and the degrading process can be observed with this method.
The typical application of spectroscopy is the check for the purity of olive oil. This application of spectroscopy method enables to classify the olive oil as “Extra Virgin”, “Virgin”, or simply “Olive Oil”. Olive oil contains triglycerides, saturated and unsaturated fatty acids. Unsaturated fatty acids are susceptible to oxidation and lead to the formation of peroxides.
This results in rancidity and degradation of olive oil over time. This can be easily evaluated with the conjugated di-enes and tri-enes of unsaturated fatty acids which absorb light in the range of 230 to 270 nm.
UV absorption spectrophotometer is the best method for the determination of the purity of organic compounds. If any impurities are present in the organic compounds then the additional peaks appear at the specific wavelength in the spectrum.
One of the best examples in the chemical industry is the purity control in alcohol. When alcohol is contaminated with benzene, benzene absorbs light at 280 nm and alcohol absorbs light at 210 nm. The measurement of the UV/VIS spectrum shows the extra peak formed at 280 nm and the contamination present in the alcohol can be determined.
UV/Vis spectrophotometer is widely used in medical sciences for the analysis of blood and urine samples. Quantitation of hemoglobin in the blood sample is the key diagnostic parameter for various diseases such as dehydration, polycythemia, and anemia.
The spectral difference between healthy blood and blood from the diseased person can be easily compared. Hemoglobin is the red blood cell that transports oxygen from the lungs to all parts of the body to maintain the viability of the cells.
Phosphorus is available abundantly on the earth’s surface. It is commonly found as phosphate. It plays an important role in the biochemical process. The plant’s growth factor increases with phosphate concentration.
Thus there is a requirement for phosphate analysis in many fields such as medical, clinical, agricultural, metallurgy, environmental science, food and beverages, detergents, fertilizers, and sugar industries.
UV/Vis spectroscopy is used for the colorimetric determination of phosphate in various market segments. The colorimetric technique measures the intensity of the colored solution as proportional to the concentration of the colored sample.
The phosphate reacts with ammonium molybdate with suitable reducing agents and forms a blue-colored complex. The intensity of the blue color is directly proportional to the concentration of phosphate in the solution.
In contrast to the fixed wavelength, spectral scanning is determined for the specific wavelength or the full spectrum of wavelength range 190 nm to 1100 nm.
Increasing awareness over the risk of skin cancer with exposure to the sun, the requirement of the sunscreen products is increased. These sunscreen products need to be tested appropriately and labeled. A sophisticated analysis method is required for the various sunscreen formulations.
Sunscreen products should either reflect or absorb UV radiation before they reach the screen so that the skin does not get burnt. The spectral region blocked in the sunscreen products is the UV-A and UV-B region which is between 280 – 400 nm. The active ingredients present in the sunscreen protect the skin from sunlight with sufficient and uniform quantity applied throughout the skin.
The traditional method of determining the effectiveness of sunscreen analysis is the quantitative analysis of the diluted samples.
Conclusion
There are many applications of UV Visible spectrophotometers. UV Visible spectroscopy is the best analytical tool for quantitative and qualitative analysis of samples for various research fields. Modern spectroscopy is easy to use, reliable, robust, and fast.